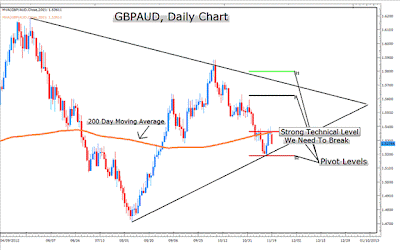
If we look at the following chart, you will see a triangle chart pattern forming. An ascending triangle chart pattern with the rising bottom. Triangle chart pattern let us to determine congested market price action so that we can take a bigger chance trading.
A great thing about triangle chart pattern trading is that our risk is determined based on main price action. In the following chart we can see the price levels that we want to concern on should the triangle continue to play course.
We can see the 200 MA and pivot point to assist us determine the risk on the transaction. The 200 MA is plotted as a support or resistance level for most traders. This mean that the foreign exchange market wouldn't push you to open long position if market price is under the 200 MA.
On the market graph above we can notice the 200 MA separating market price down the middle. We can find to transaction back to the top of the triangle chart pattern if market price as crossed and closed above the 200 MA. You should not take a risk until the 200 MA Moving average indicator is below the market price.
Market price is under the 200 MA and stay at 1.5361. We can use an entry order to open trading position if market price touches this price level. We also use the pivot point levels that market price has respected in light of the triangle chart pattern. If you are not familiar with pivot point trading system, they are made from the first to the last of the current month based on last month's market price action. There are so many Foreign exchange traders use pivot point levels with chart pattern to assist them determine entry levels.
The second price level of support (S2) align with the rising triangle when you see a bullish engulfing pattern. We can use this as a stop loss level and plot our risk under the 2nd support because market price refused moving under this support level before.
We now have a determined entry with the 200 MA trend indicator. We have a risk level plot under the second support level which is built the ascending triangle chart patter. And then we will find at reliable targets.
The MA trend indicator is trade 175 points from the second support price level. And we have to look for a target at least 200 points. The pivot points level is at 1.5630 or 266 points from the target. We can also set our target at the highest of the triangle chart pattern.


No comments:
Post a Comment